Plots gene or transcript expression overlaid on a given embedding. If multiple features are supplied the joint density of all features will be plotted using Nebulosa
Arguments
- seu
A Seurat object
- embedding
Dimensional reduction technique to be used
- features
Features to plot
- dims
Dimensions to plot, must be a two-length numeric vector
Examples
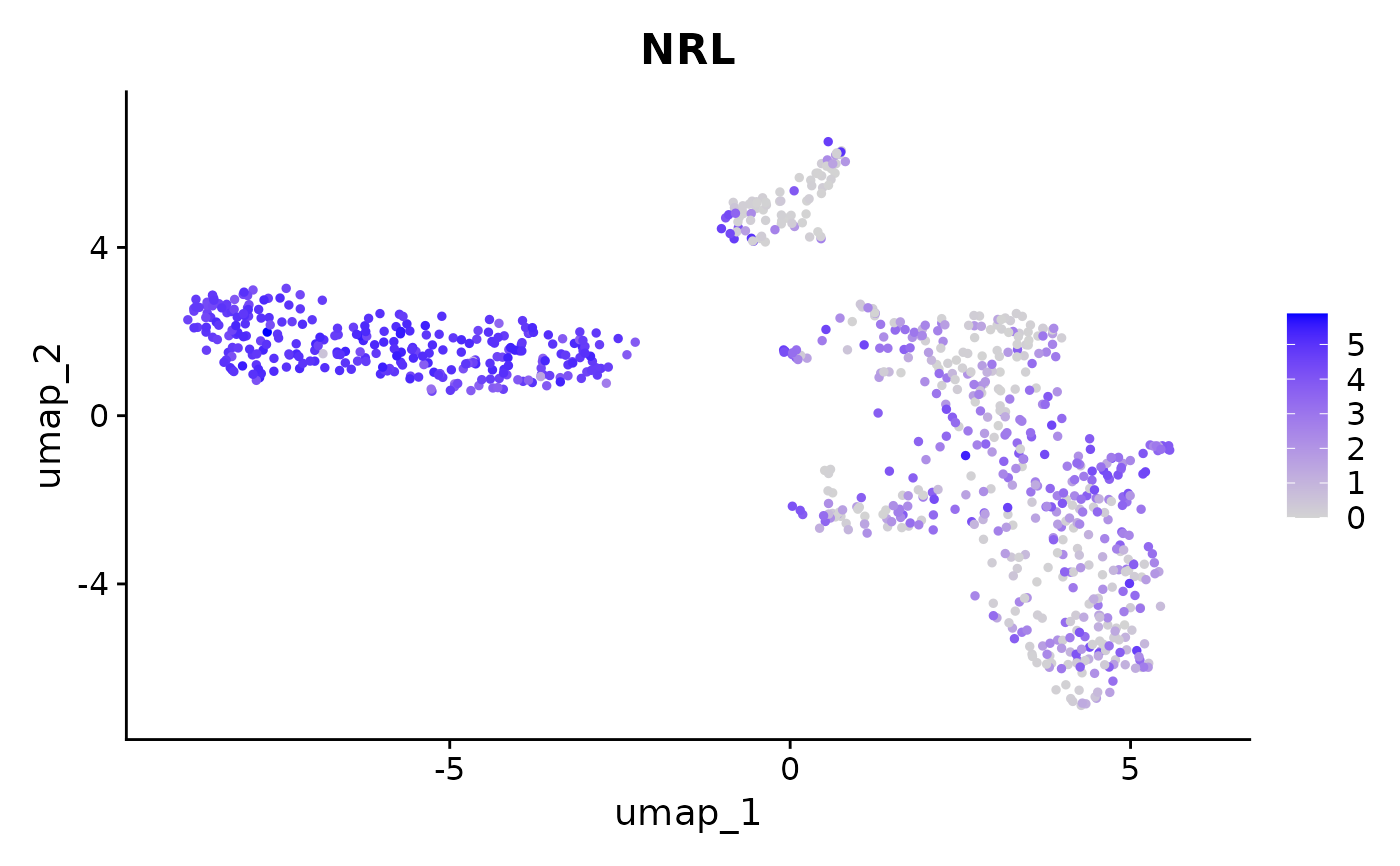
# static, single feature
plot_feature(human_gene_transcript_seu, embedding = "umap", features = c("NRL"), return_plotly = FALSE)
#> Warning: partial match of 'just' to 'justification'

# static, multi-feature
plot_feature(human_gene_transcript_seu, embedding = "umap", features = c("RXRG", "NRL"), return_plotly = FALSE)
#> Warning: The following requested variables were not found: RXRG
#> Error in .extract_feature_data(exp_data, features): 'RXRG' feature(s) not present in meta.data or expression data
# interactive, multi-feature
plotly_plot <- plot_feature(human_gene_transcript_seu, embedding = "umap", features = c("RXRG", "NRL"))
#> Warning: The following requested variables were not found: RXRG
#> Error in .extract_feature_data(exp_data, features): 'RXRG' feature(s) not present in meta.data or expression data
print(plotly_plot)
#> Error in eval(expr, envir, enclos): object 'plotly_plot' not found