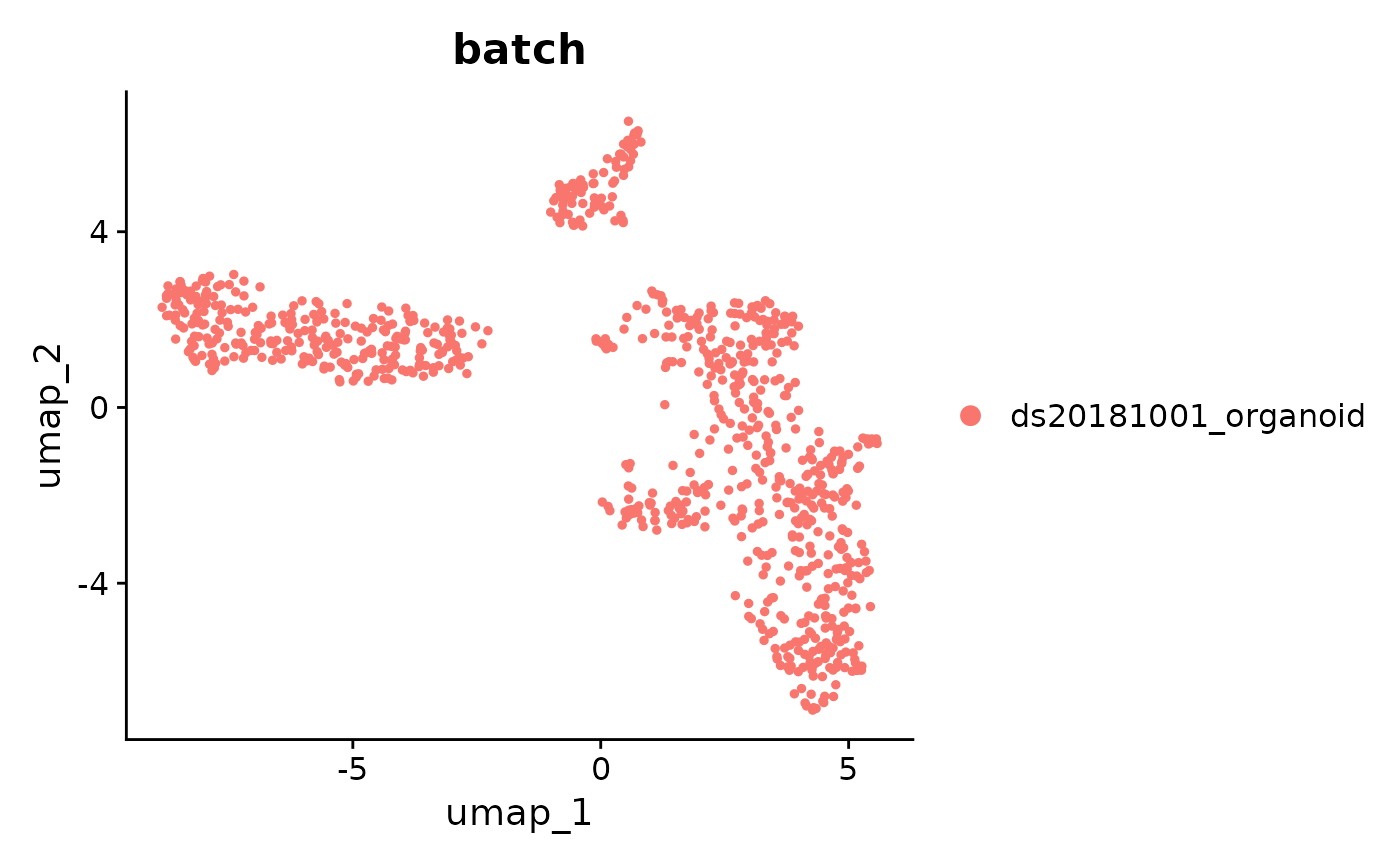
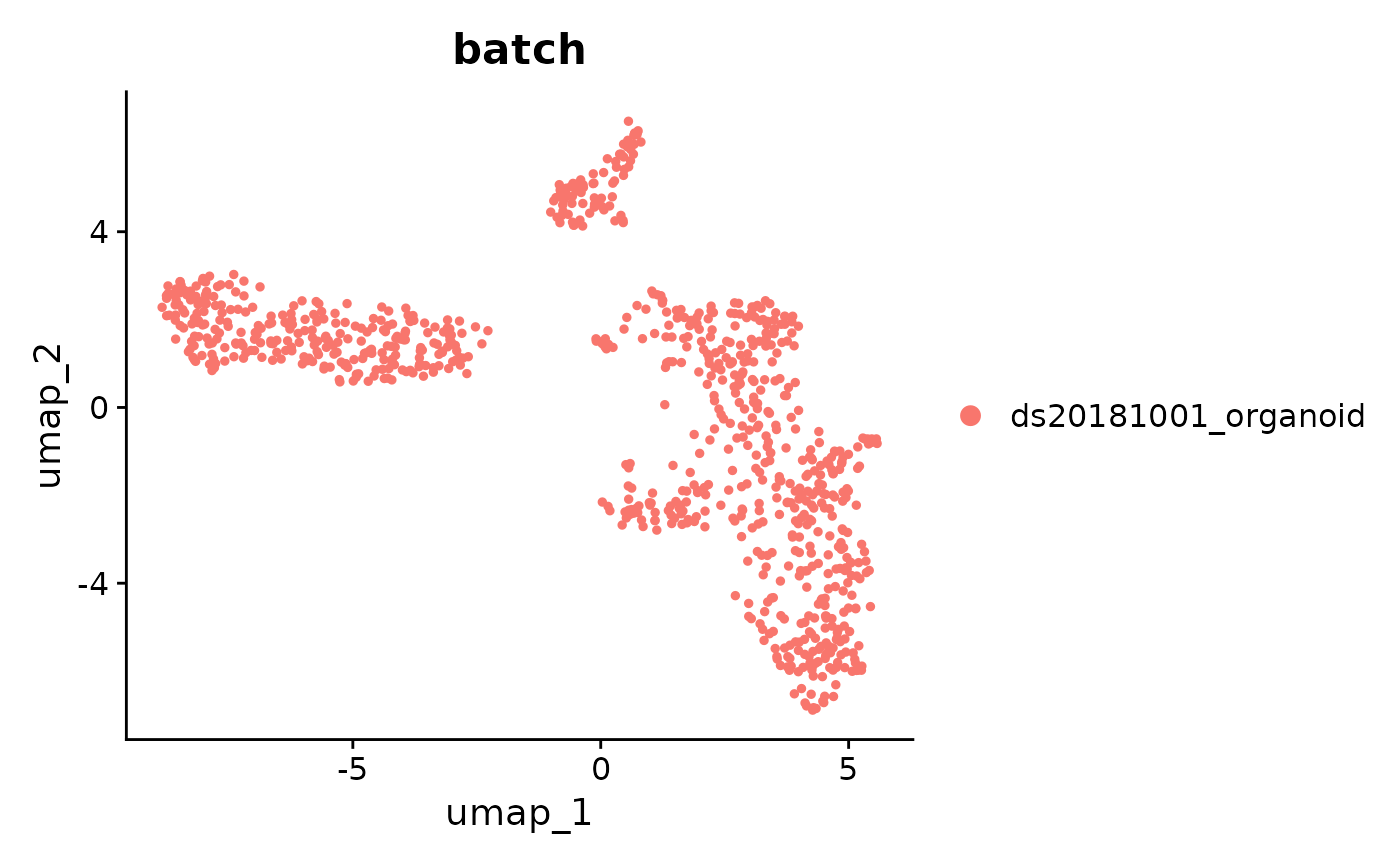
Plots static or interactive plot where each point represents a cell metadata variable whose position on the map depends on cell embeddings determined by the reduction technique used
plot_var(
  seu,
  group = "batch",
  embedding = "umap",
  dims = c(1, 2),
  highlight = NULL,
  pt.size = 1,
  return_plotly = FALSE,
  ...
)
Arguments
- seu
A Seurat object
- group
Name of one or more metadata columns to group (color) cells by.
- embedding
The dimensional reduction technique to be used
- dims
Dimensions to plot, must be a two-length numeric vector
- highlight
A list of character or numeric vectors of cells to highlight
- pt.size
Adjust point size on the plot
- return_plotly
Convert plot to interactive web-based graph
- ...
Examples
# static mode
plot_var(human_gene_transcript_seu, group = "batch", return_plotly = FALSE)
#> Warning: partial match of 'just' to 'justification'


# interactive plotly plot
plotly_plot <- plot_var(human_gene_transcript_seu, group = "batch")
print(plotly_plot)
#> Warning: partial match of 'just' to 'justification'
